Ultimate Terminology and Definitions Guide
This guide breaks down the key terms and definitions you’ll see throughout your video analysis in PB Vision. It’s designed to make the stats and visuals easier to follow so you can clearly understand what’s happening in your matches and how to improve.
For players who want to go beyond the basics, we also recommend checking out our Beyond the Basics guide, which explores more advanced uses of PB Vision’s stats.
You can also learn from the community by watching George Murphy’s PB Vision Tutorial. This is an in-depth walkthrough created by a subscriber who shared his perspective on how to get the most out of the platform.
👁️ Insights, Analytics, and Stats
From lowest to highest level: Stats → Analytics → Insights
Insights: The ultimate goal—actionable recommendations provided directly, without needing to perform the analysis yourself. The plan is to expand Insights Reports to offer actionable recommendations, for example which skill to prioritize to enhance player skill rating.
Analytics: This is how most users interact with the app, using tools to analyze the stats and identify areas for improvement. For example using Shot Explorer to assess dink success rate.
Stats: Refers to raw data, such as JSON data files or Excel exports, that can be used for deeper analysis.
Highlights
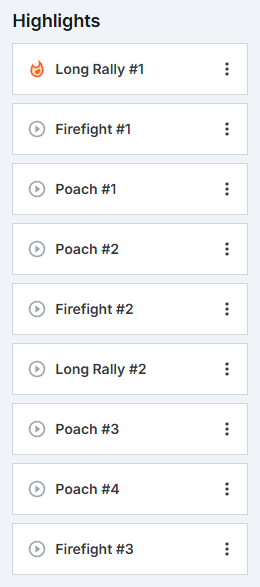
Just as the name suggests, these are the noteworthy plays during the game. PB Vision is designed to identify and showcase ATPs, Ernes, Poaches, Firefights, and Long Rallies.
If you're looking for share-worthy footage to post, this is the place to start!
Player Stats Tab
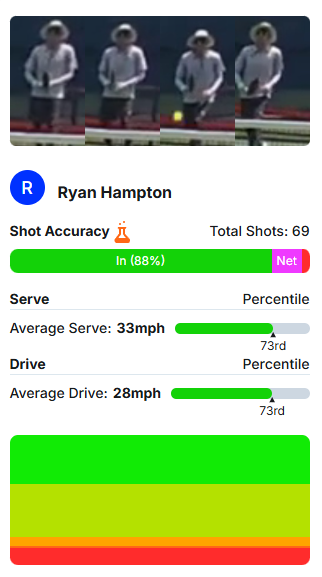
This is where we dive into the details of each player’s performance related to serves, returns, lobs, drives, and so much more. Let's break it down:
Total Shots
Here, you can see how many times you hit the ball throughout the entire game. It's a good indicator of your activity level—especially how it stacks up with the other players.
Shot Accuracy
Here, you can see your percentages of in, out, and net shots.
Avg Serve (Mph)
Despite the name, we actually use the median to represent your serve speeds. The median is the middle number in your series of serves. For instance, if you only served three times at the speeds of 20mph, 21mph, and 30mph, the median would be 21mph. This approach offers a more accurate picture of your typical serve speed compared to just averaging the numbers.
Serve Percentile
We compare your median serve speed from the game against all the serves we’ve analyzed (which is quite a lot!). Your percentile ranking shows how you stack up. For example, if you're in the 80th percentile, that means 20% of the serves we've analyzed are faster than yours and 80% are slower.
Average Drive (Mph)
Similar to the median serve, this stat focuses on all the drives you made during the game and finds the median speed. Drives are those powerful shots that either land deeper in the court or would if not intercepted first by your opponent. This number helps you gauge your consistency and power.
Drive Percentile
This tells you how your median drive speed compares to all the other drives we’ve analyzed. It's a cool way to see where you stand among other players.
Court Coverage
Ever wondered where you’ve been on the court the most? The court coverage heatmap shows your movements and gives an estimate of how many feet you’ve traveled during the game. This is also a good indicator of your spacing. Are you hugging the centerline leaving yourself open to shots down the side?
Our program is also advanced enough to recognize if you switch sides with your opponents - just don’t change your outfit mid game 😉
Serves & Returns
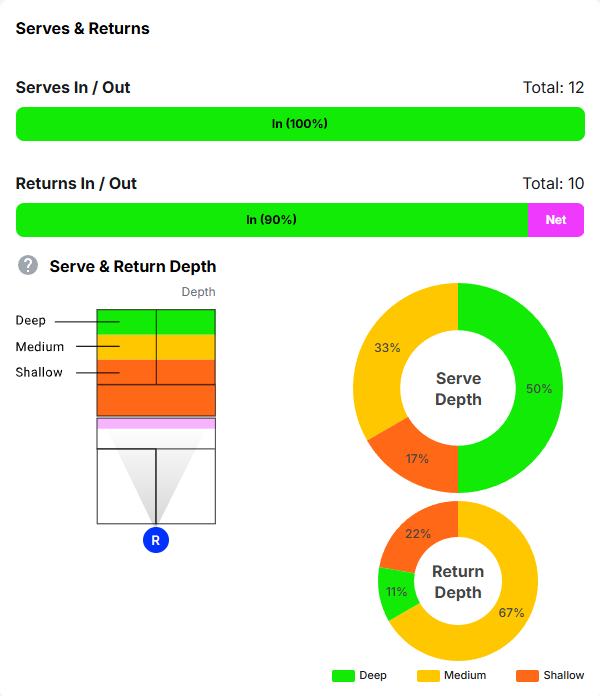
We break the court into sections and calculate how many of your serves landed in each area. Deep serves are what you want since they force your opponent to stay back longer and away from the kitchen.
Next, we show the same thing with returns. This is arguably more important than a deep serve. A shallow return allows your opponent a much higher chance at reaching the kitchen line to even the playing field.
3D Shot Chart
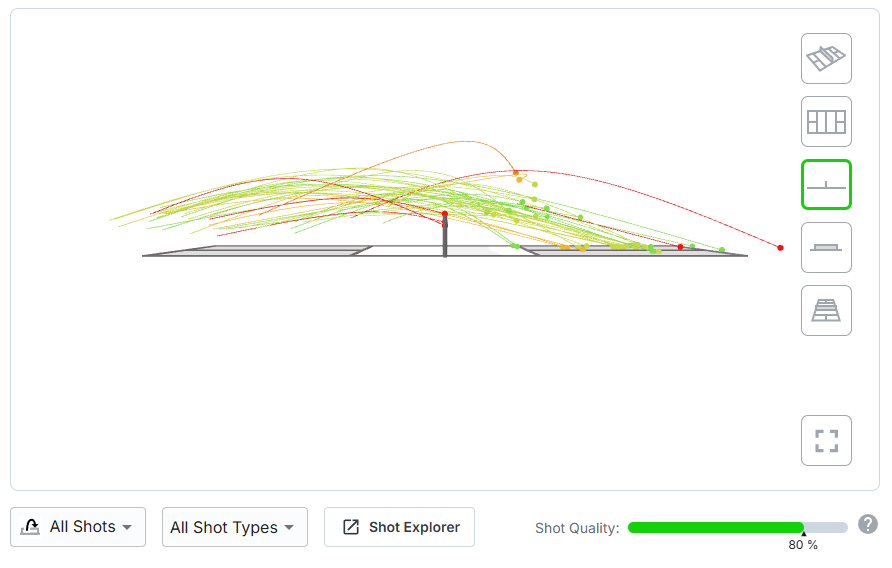
This interactive section is one of our favorites. You get to look at a 3D model of various shots, including:
Serves (1st shot)
Returns (2nd shot)
3rd Shots
4th Shots
5th Shots
You can also use the secondary filter to view specific shot types (drops, drives, and lobs).
Are your drives staying low and close to the net? How well are you executing your 3rd-shot-cross-court drops? Can you purposefully aim your serve to your opponent's backhand? Do you tend to send all your drives down the middle turning it into a predictable shot?
Visualizing all these different shots allows you to see what needs your attention. You can also combine this with your shot quality score (explained below) to know right away if something needs your attention.
Shot Quality
Shot quality is an average of how well a specific type of shot is executed.
Drops are evaluated based on how attackable the ball would be if the receiver was perfectly situated on their kitchen line.
Drives are evaluated based on how high over the net the ball flies (lower is better) and how deep in the court the ball lands (or would land if not hit).
Lobs are evaluated based on how deep in the court the ball lands (deeper is better).
Shot quality measures how well a shot was executed for that shot type. It is not a full judgment of whether the shot was the perfect tactical choice, and it does not automatically become "excellent" because the opponent made an error later in the rally.
For example, a drop is judged by how attackable it would be for an ideally positioned opponent at the kitchen. A drive is judged by traits like height over the net and depth. A lob is judged heavily by depth. Context still matters when you review the video: a lower-quality shot can win the point, and a high-quality shot can still lose the rally if the next ball goes badly.
Team Stats Tab
This section breaks down stats for team performance.
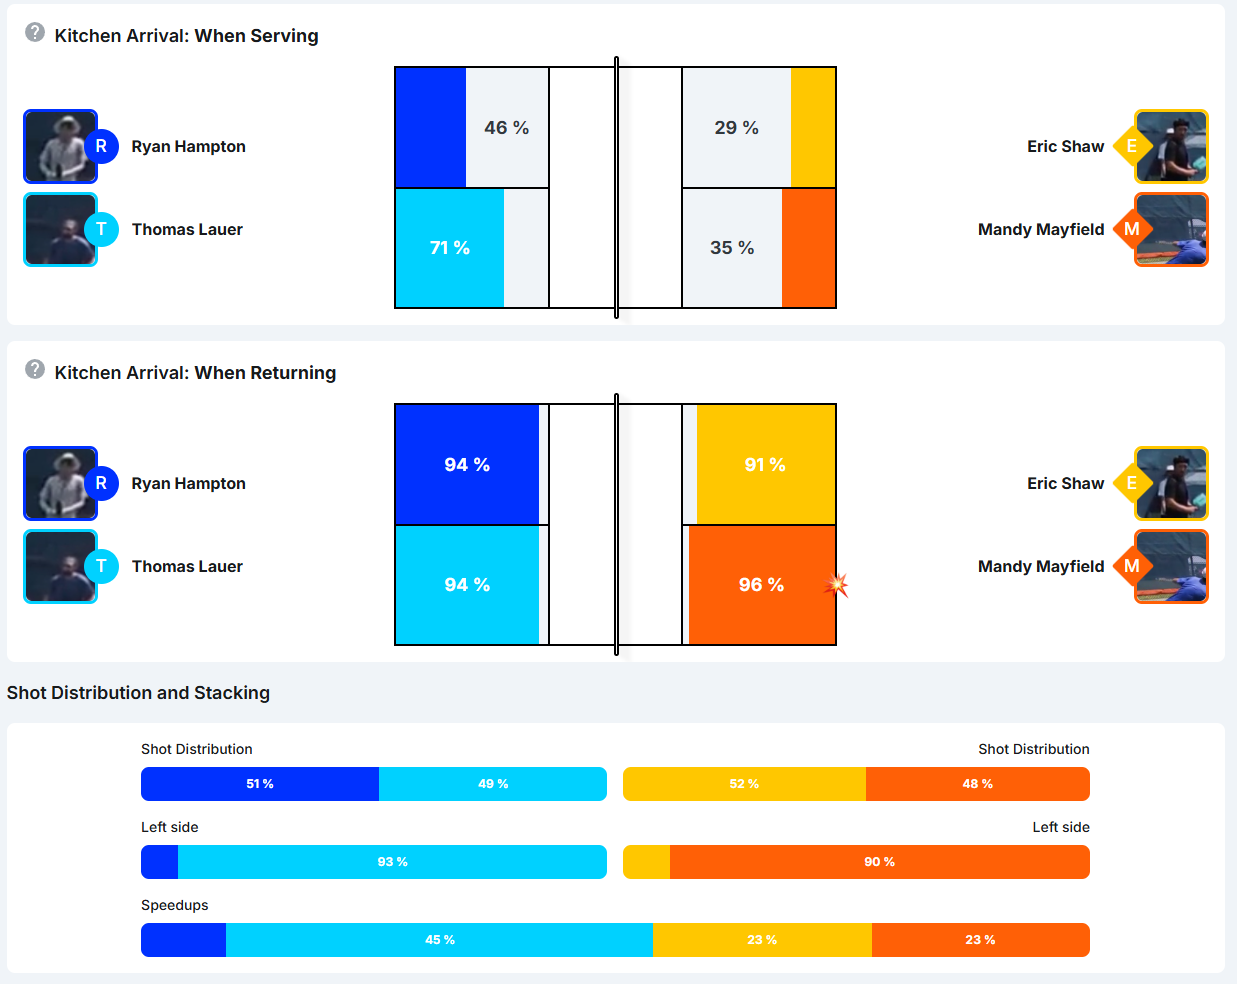
Kitchen Arrival
This represents how often each player reaches the kitchen line during rallies when your team is serving. It's crucial for understanding your team’s net play efficiency.
Kitchen Arrival is best used as a team transition metric. It looks at whether the serving team gets to the kitchen in rallies where there is enough time to evaluate that transition. Very short rallies may be excluded because the serving team never had a realistic chance to reach the kitchen.
Use this stat to understand net-play habits over many rallies, not as a frame-by-frame judgment of whether one player sprinted forward on every point.
Shot Distribution
Ever wondered how the shot-taking is split between you and your teammate? This section compares your total shots versus your partner’s, color-coded to match each player's profile.
Left Side Play
This shows how often you were on the left side of your partner. A stat closer to 50/50 that would mean you didn’t stack while a percentage like 90/10 would mean you used the stack on offense or defense throughout the game. Experimenting with stacking on offense or defense to see how it translates to performance is important when working with a new partner.
Game Stats Tab
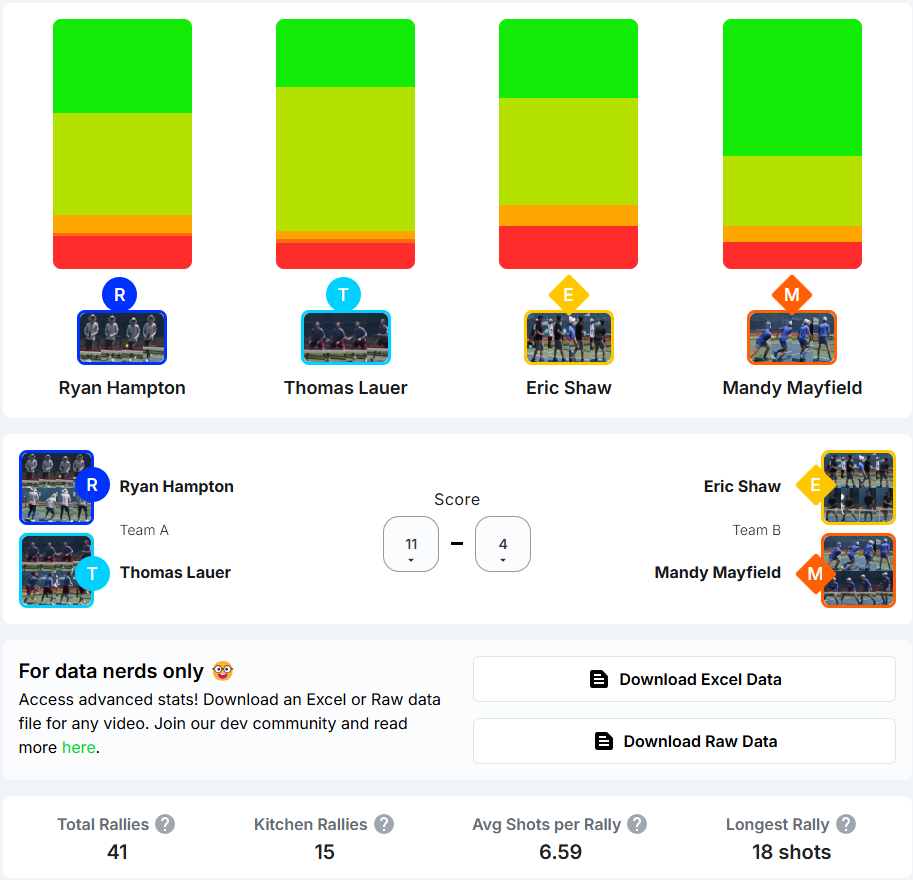
This section provides a general summary of the game.
Total Rallies
The total number of rallies in the game.
Kitchen Rallies
The number of rallies where all players get to the kitchen, giving insight into net play dynamics.
Avg Shots per Rally
In most cases, more experienced players will have a higher average of shots per rally than less experienced players. This is a good indicator of fewer risky moves resulting in errors and fewer mistakes in general.
Longest Rally
This shows the most hits in a single rally, showcasing the game’s most intense rally. It’s also showcased under the Highlights portion of the analysis and marked with a 🔥next to the rally number.
We hope this breakdown helps you understand your game better and helps you find areas for improvement.
If you need ideas for where to start then you’ll want to read [THIS] article for examples on how to use video analysis and stat reviews for deliberate improvement.
🔍 FAQ
How is all this information calculated?
We’ve created and trained our own AI program by having it analyze thousands of games.
What if I see something wrong, mission or incorrect?
Please contact support through our in app widget (accessible via the question mark on the top right while signed into the app).
⁉️ Looking For More?
If you still have questions or run into issues, check out our Contact Us guide for the best way to reach our support team.